
DevOps and Infrastructure for Web3: A Practical Guide
You're on call. The status page is green, and a user just posted a wallet balance that doesn't match the chain. Every host is healthy. The RPC gateway is answering. The number is still wrong, because the node behind that request is an hour behind head.
That moment is the job. DevOps and infrastructure for a protocol isn't only about keeping a process up. It's about whether the data users act on is economically correct, and whether a bad deploy can change that data before anyone notices.
Hiring managers look for the same split. A candidate who can name Kubernetes and Terraform still stalls when asked how they'd prove a release didn't serve stale state. What follows is the stack you run, the controls that protect stake, a contract pipeline that won't ship unverified bytecode, reliability targets users feel, and the interview answers that show judgement instead of a tool list.
Where DevOps Meets Blockchain Infrastructure
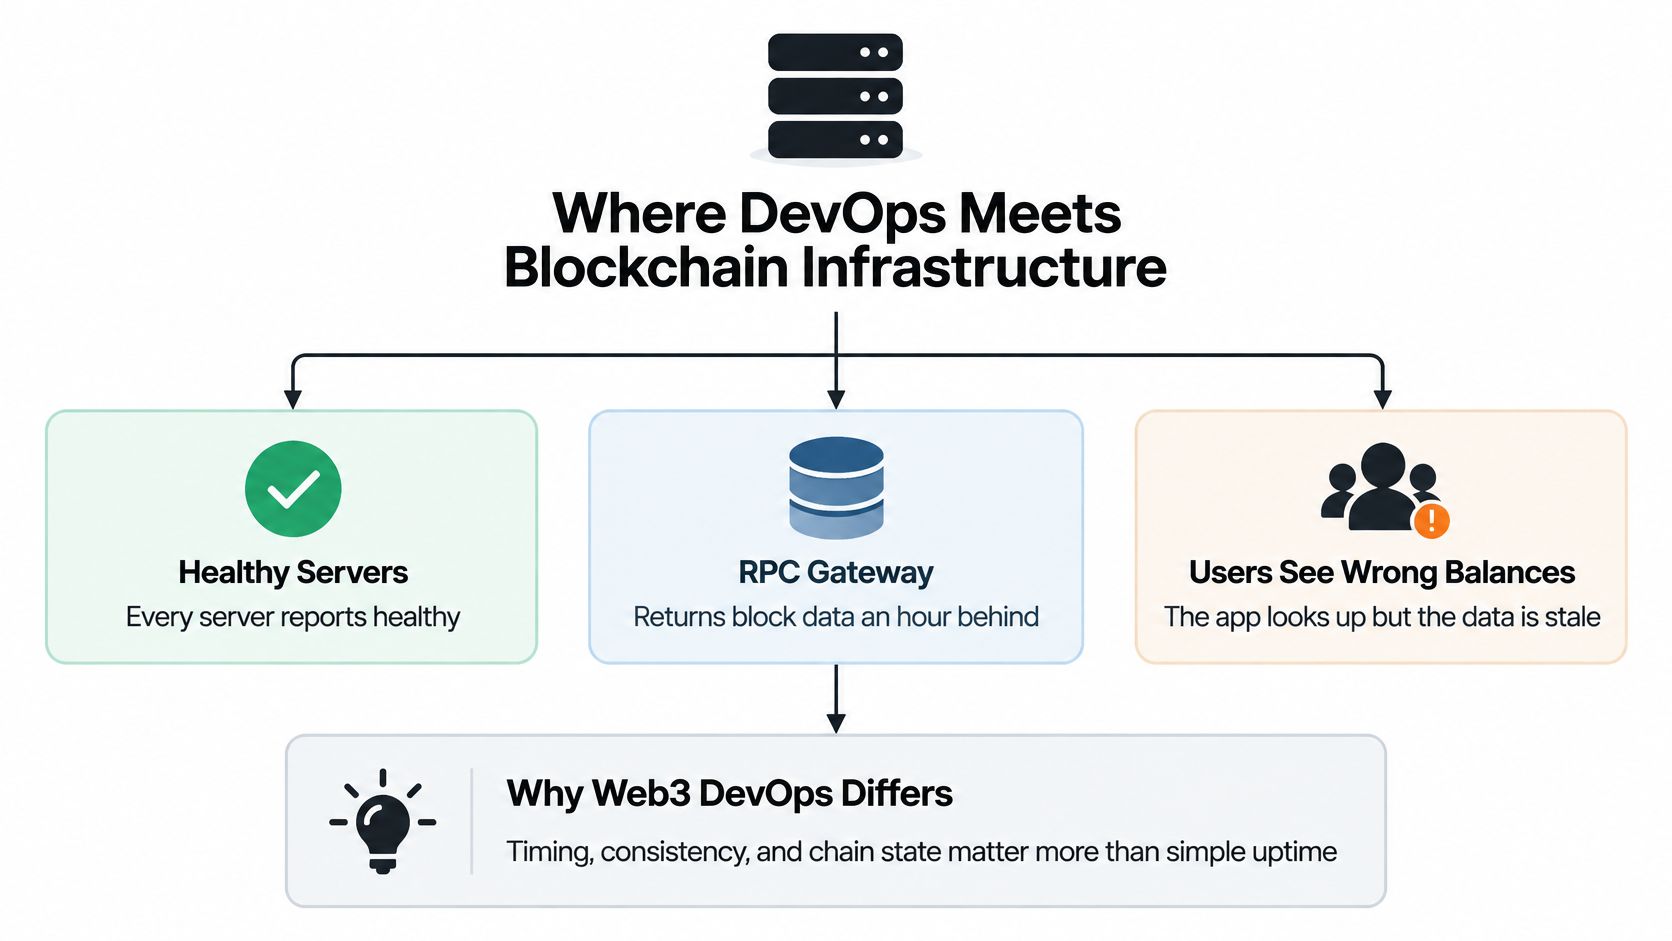
Say the RPC gateway returns block data an hour behind while every server reports healthy. The app looks up. Users still see wrong balances, and a swap or a withdrawal can go out on that stale read. A web service can treat a healthy process as success. Here, success is chain state that matches what the network has already accepted.
A city map makes the ownership clear. Full nodes are the public record office, each keeping its own copy of the ledger. Validators are the notaries who sign each entry. RPC gateways are the counter clerks who answer questions and accept submissions. Indexers are the archivists who make the ledger searchable. Execution of that ledger happens inside a virtual machine, so it helps to know how a blockchain virtual machine runs contract code before you debug a bad state root. Around those four sit the contract pipeline, the bridge or oracle relayer, and the monitoring stack that should notice when the clerks are polite and wrong.
| Component | What It Does | Typical Failure | Usual Owner |
|---|---|---|---|
| Full node | Stores and validates chain state | Falls behind after a missed upgrade | Node operations |
| Validator | Signs blocks and attestations | Missed duties from downtime or key errors | Validator operations |
| RPC gateway | Serves reads and transaction submission to apps | Stale responses under load | Platform or SRE |
| Indexer | Turns chain data into queryable records | Block lag and growing backlog | Data infrastructure |
| Smart contract pipeline | Compiles, tests and deploys contracts | Unverified or misconfigured deployment | Protocol engineering |
| Bridge or oracle relayer | Moves messages or prices between systems | Stale data or a stuck message | Protocol and security |
| Monitoring stack | Collects metrics, logs and alerts | Blind spots that hide chain-level faults | SRE |
Containers, keys and drift
Most of these components run as containers, with chain-specific logic inside the image. In 2025, 82% of container users were running Kubernetes in production, up from 66% in 2023, according to the Cloud Native Computing Foundation's annual survey as reported by Computer Weekly. The cluster keeps the pod scheduled. It doesn't keep the copy of the chain honest.
Practical rule: Standard infrastructure keeps processes alive. DevOps for Web3 also keeps chain data correct and deployments safe.
Provision the fleet with infrastructure-as-code such as Terraform, and hold validator keys in a secrets manager rather than on the host. That pairing is where most configuration drift starts. A manual edit on one box survives until the next apply, then peers drop or a key path points at an empty file. Interviewers ask who owns each row, because an engineer who can't name the owner can't name the page.
Node and Validator Operations Day to Day
A validator missed duties for six hours after a client upgrade nobody had tested. The host was up. The client had left the canonical chain. Node work is mostly routine, and the routine protects stake and reputation. Slashing removes part of the stake, and a restart won't put it back. The economics sit in what staking actually commits.
- Upgrades: On the network schedule, staging node first, written runbook.
- Sync and peers: Continuous alert once lag passes a set threshold. Silent lag goes unnoticed.
- Disk, snapshots, backups: Weekly. A full disk halts the node, and a backup counts only after a tested restore.
- Signing keys: Quarterly backup and access review, through a remote signer with least-privilege access.
- Failover: Quarterly timed drill against a written switch procedure, so you know real recovery time.
- Double-sign check: After every host change. Never run two live signers with the same validator key.
| Task | Cadence | Risk If Skipped | Control |
|---|---|---|---|
| Client and protocol upgrades | On the network schedule, after a staging test | Node forks off the canonical chain | Staging node and upgrade runbook |
| Peer and sync health checks | Continuous | Silent lag that goes unnoticed | Alert when sync delay passes a set threshold |
| Disk, snapshot and backup checks | Weekly | Full disk halts the node | Disk alerts and a tested restore |
| Signing key backup and access review | Quarterly | Lost or leaked key | Remote signer with least-privilege access |
| Failover drill | Quarterly | Slow switch during a real outage | Timed drill with a written switch procedure |
| Double-sign prevention check | After every host change | Slashing penalty | Single active signer enforced |
The practical setup is one active remote signer and a hot standby ready to take over. I would not add a second live signer "just in case." A candidate who can state these cadences and the slashing rule is ready for on-call questions.
How to Build a Smart Contract CI/CD Pipeline
A contract deploy is a one-way door. The pipeline exists so bytecode, parameters, and authority match what was reviewed, not whatever a laptop happened to compile.
Pin, test, and prove the bytecode
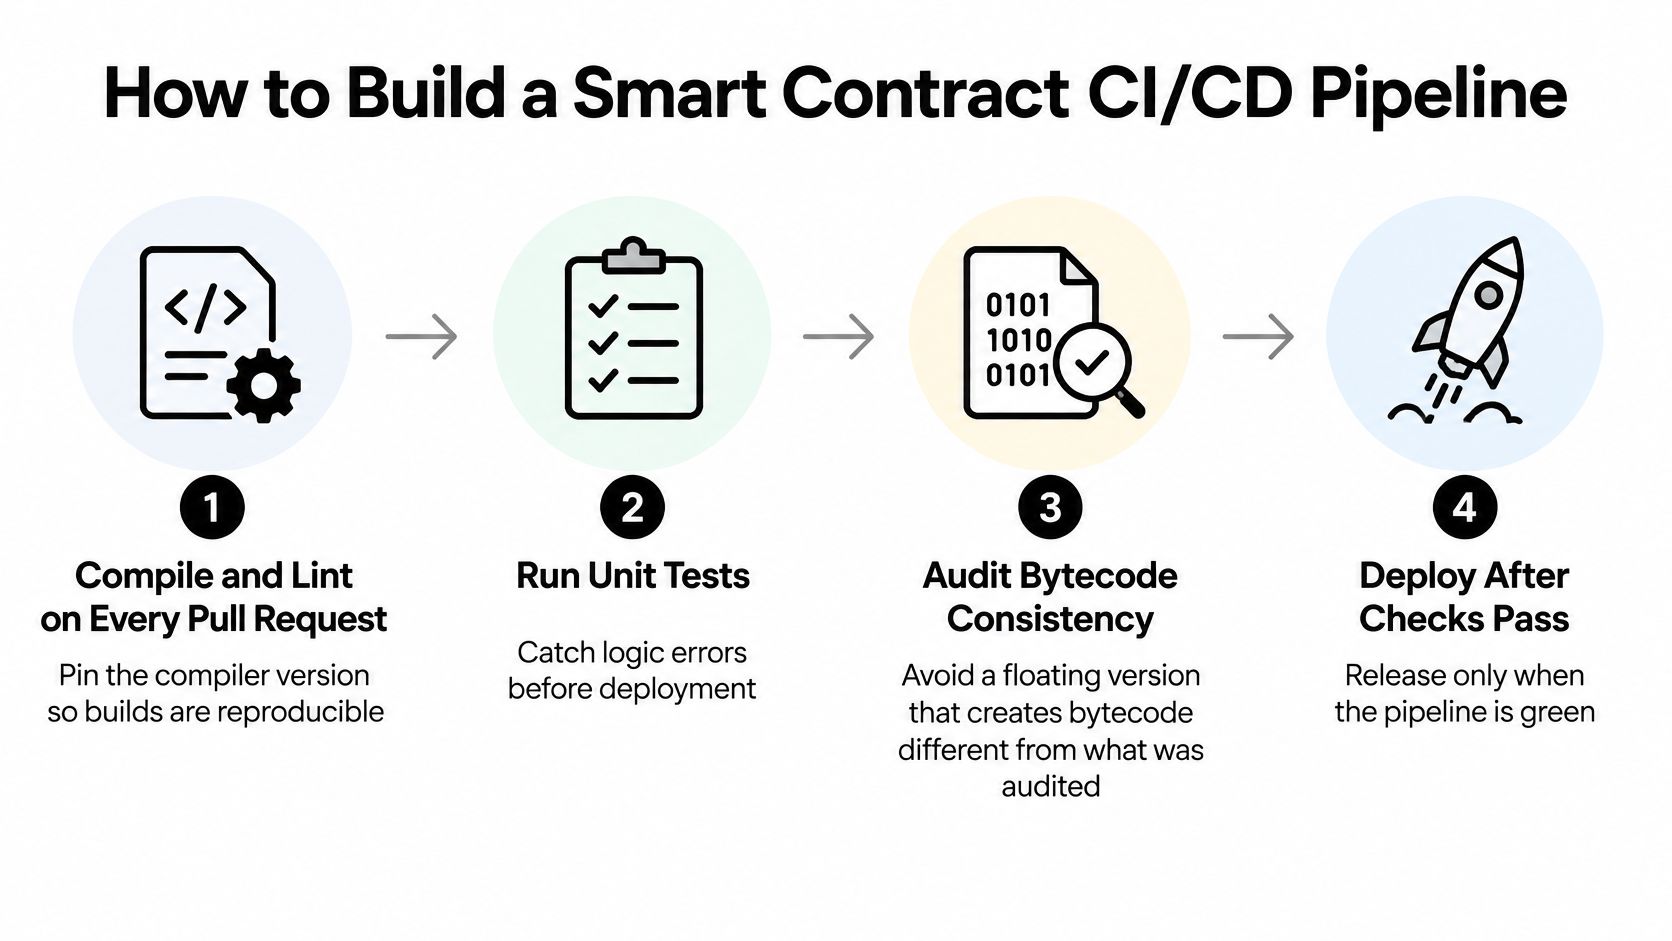
- Compile and lint on every pull request. Pin the compiler version, for example a specific
solcrelease, so two machines produce the same bytecode. A floating version is a common reason the deployed code differs from what was audited. The slip is a CI image that tracks "latest" while the audit used last quarter's compiler. - Run unit tests and fork tests against a recent mainnet snapshot. Unit tests catch local logic. Fork tests exercise integrations with real token contracts, routers, and oracles. The slip is a suite that only mocks those calls, then fails the first time it meets mainnet storage layout.
- Run static analysis and fail the build on high-severity findings. Slither is the usual first pass. Tune the rules to your patterns instead of silencing the job. The slip is a baseline full of ignored detectors, so a real high-severity issue looks like noise.
Release only through controlled authority
- Deploy to a public testnet with a script, never by hand. Store the deployment addresses as a build artifact so the next job, and the reviewer, can see exactly what landed. Hand deploys drift from the script you think you ran.
- Verify the source on the block explorer. Users and auditors should read the code they interact with. Unverified bytecode is a support incident waiting for a bad weekend.
- Ship upgrades only through a multisig and a timelock. One compromised key must not be able to change the contract overnight. The common slip is a testnet config that skips the timelock delay, so production inherits a path nobody waited on.
- Run post-deploy checks. Confirm owner roles, parameter values, and one small canary transaction before you announce the release. A green compile doesn't prove the proxy admin is the address you think it is.
A release goes out only when every check is green and a second engineer has reviewed the deployment script.
If you're moving from this pipeline into cloud interviews, explore AWS CI/CD interview scenarios and practice explaining why a stage exists, not only which product runs it. Hiring managers score the sign-off rule. They want the person who will hold a mainnet push when the timelock was bypassed in staging.
Monitoring Chain Health With Web3 SLOs
A status page can show 99.99% API uptime while failed transactions and stale chain state fill the support queue. Users don't feel process uptime. They feel whether a read is correct, whether a transaction gets included, and whether a price is still fresh.
SLOs are now the usual reliability frame. 56% of organizations use SLOs, up from 31% in 2024, and 89% of teams with SLOs use availability targets such as 99.9%, 99.95%, and 99.99%, according to the 2026 State of DevOps report. Those percentages don't translate until each service has one indicator a user would recognize. A generic uptime check, the kind you'd use when keeping client websites reliably available, will stay green through a stuck bridge.
| Service | User-Facing Indicator | Example Target |
|---|---|---|
| RPC gateway | Share of requests answered without error | 99.9% over 30 days |
| RPC gateway latency | p95 read latency | Set from measured baseline and agreed per provider |
| Transaction submission | Share of transactions included within a set block count | 99% within 3 blocks |
| Indexer | Block lag behind chain head | Under 5 blocks |
| Oracle feed | Age of the last price update | Within the protocol's heartbeat |
| Bridge | Settlement time per message | Within the published window |
Error budgets when money can move
Treat the targets as a starting point and adapt them per chain and per product. A failed read consumes a little error budget. A stuck bridge transfer, or anything that looks like a double-spend risk, consumes far more, because the user can't retry into the same state. Irreversible or financially consequential failures need a stricter budget, or they should freeze writes until a human clears them.
Failover that doesn't lie
More providers are not automatically more correct. Switching RPC vendors mid-request can return inconsistent reads if one node is behind. The failover rule should check block height agreement before it serves the response, and it should refuse a write when the providers disagree. Extra validator, oracle, and bridge operators can cut correlated outages, and they can also create divergent state that your dashboard never named.
Define the indicator, the window, and the owner for each service before you build the dashboard. A chart without an owner is a screenshot, not an SLO.
Scaling RPC Gateways, Indexers and Validators
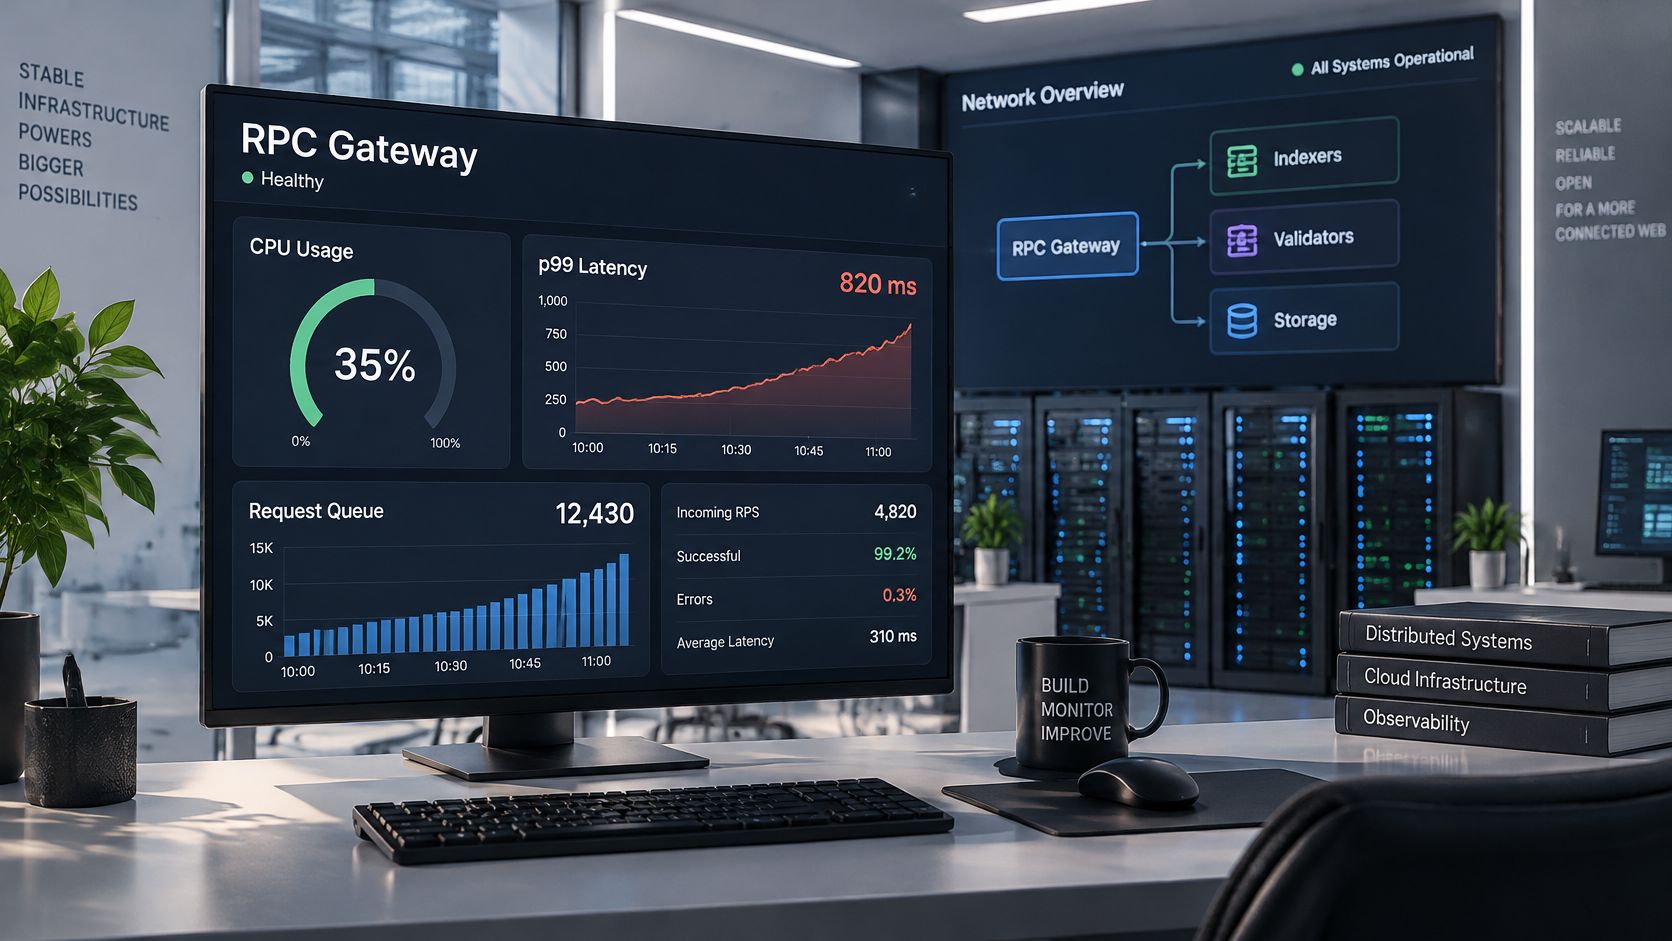
An RPC gateway can sit at moderate CPU while p99 latency climbs. Requests may be waiting on disk or upstream nodes rather than competing for processor time, so scaling on CPU alone can add replicas without clearing the bottleneck. Slow or stale responses are an economic correctness issue when applications use them to price trades, check balances, or submit transactions.
A study compared a reinforcement-learning autoscaler with Kubernetes HPA, VPA, and KEDA on latency-sensitive microservices running on a nine-node Amazon EKS cluster. The controller reported up to 30% higher CPU utilization, 15 to 20% lower 90th-percentile latency, and approximately 20% lower cost, as described in the autoscaling study. Those results are specific to the workloads tested. Before adopting a different controller, compare it against your chain clients, traffic mix, and storage constraints.
| Workload | Scaling Signal | Guardrail | Approach |
|---|---|---|---|
| RPC gateway | Request rate, queue depth, and p99 latency | Maximum scale-out cap and stabilization window | Horizontal autoscaling |
| Indexer workers | Ingestion backlog and database write latency | Check database capacity before scaling workers | Horizontal workers over partitioned block ranges |
| Full node | Disk growth and sync speed | Pre-provisioned storage | Vertical resize in a maintenance window |
| Validator | Signing status and node health | Single active signer | Hot standby, not extra signing replicas |
| Shared cache | Cache-miss rate | Memory limit and eviction policy | Horizontal scaling with a shared cache |
Signals tied to user pain
For RPC gateways, track request rate alongside queue depth, errors, cache misses, and tail latency. CPU alone can miss a queue forming on storage or an upstream provider. If you are choosing where traffic enters the cluster, compare API gateways and service meshes based on the failure you need to contain, such as stale reads under load.
For indexers, watch block lag, ingestion backlog, database write latency, and reorganization repair time. Adding workers can increase database pressure rather than reduce lag. Partition block ranges deliberately and confirm the database can absorb the added writes.
Validators need a different scaling model. Size the hardware for the signing workload and keep a hot standby ready; a second active signer creates slashing risk, not safe capacity. Interviewers will expect candidates to explain how they prevent duplicate signing during failover.
Set resource requests and limits from measured usage, then add stabilization windows, a maximum scale-out cap, and disruption budgets. Load-test before a known traffic event. The autoscaler should respond to bottlenecks you can identify, not discover its limits in production.
Measuring Delivery Performance With DORA Metrics
A team that deploys ten times a day can look elite on frequency while a large share of that work is hotfixes. Speed without the stability numbers is a vanity chart.
DORA's 2024 research evaluates delivery through deployment frequency, change lead time, change-failure rate, and failed-deployment recovery time, and it adds deployment rework rate for the share of production work spent correcting defects instead of shipping planned work. High performers tend to do well on throughput and stability together. Faster releases don't have to mean a less reliable chain service, and a fast team that only wins on frequency isn't in that group.
- Change lead time runs from commit to successful production deployment.
- Deployment frequency is how often changes reach production.
- Change fail rate is the share of deployments that need immediate intervention.
- Failed deployment recovery time is how long it takes to restore service after a failed deployment.
- Deployment rework rate is the share of deployments that are unplanned corrective work.
| Metric | What It Measures | Web3 Example |
|---|---|---|
| Change lead time | Time from commit to production | Contract fix from merge to mainnet |
| Deployment frequency | How often changes reach production | RPC configuration pushes per week |
| Change fail rate | Share of deployments needing immediate fix | Indexer schema migrations rolled back |
| Failed deployment recovery time | Time to restore service after a failed deployment | Node client rollback duration |
| Deployment rework rate | Share of work spent on unplanned corrective fixes | Hotfix share of sprint capacity |
Record commit timestamps, deployment events, rollbacks, hotfixes, and incident resolution times separately for protocol services, indexers, RPC endpoints, and contract tooling. Segment by service. One healthy protocol must not hide a failing indexer inside an average.
Raise release frequency only while change fail rate and recovery time stay inside explicit service-level objectives.
Treat rework rate as the early warning. A rising rate often points to weak tests, unsafe migrations, thin canary coverage, or gaps in observability, even when deployment frequency still looks healthy. That dashboard is also the vocabulary distributed teams can share without arguing about which tool is "real" DevOps.
Career Paths and Interview Questions for DevOps Roles
The candidate lists Terraform, Kubernetes, and Prometheus, then can't say how they'd know a release made things worse. Interviewers test judgement, and the same tools mean different things at junior scope and at staff scope.
DORA's metrics history is explicit that interviews should test whether you can measure delivery, not merely name tools. The five measures are change lead time, deployment frequency, failed deployment recovery time, change fail rate, and deployment rework rate. Career-ready answers show how you'd instrument them, find the bottleneck, and raise throughput without giving up reliability.
| Level | Typical Scope | What Interviewers Test |
|---|---|---|
| Junior | Single service, scripted tasks | Clean builds, basic container and CI skills |
| Mid-level | Full pipeline for one service | Tests in CI, safe deployments and a usable runbook |
| Senior | Several services and their on-call | Metric choice, rollback design and incident handling |
| Staff / Principal | Cross-team platform and standards | Reliability targets, toolchain design and trade-offs |
| Director | Multiple teams and budgets | Hiring, capacity planning and delivery governance |
| VP / C-level | Organization-wide reliability and cost | Risk strategy, vendor and provider decisions |
Three questions, one answer shape
Prepare three scenarios, and answer each in the same three beats: name the signal, name the guardrail, name the rollback.
Instrument an indexer. The signal is block lag plus rework rate, not deploy count. The guardrail is a lag SLO you won't trade away for faster schema changes. The rollback is a reversible migration and a previous image you have already restored in staging.
A failed deploy across a node fleet. The signal is peer count and sync delay on the canary cohort. The guardrail is a canary order that pauses the validators you'd rather not touch first. The rollback is the previous client, applied from the runbook, with signing stopped on any host you aren't sure is unique.
Toolchain shape. The signal is deployment metadata attached to the incident automatically. The guardrail is a policy check on the pull request, not a wiki reminder. The rollback is a known-good release you can point to from that same incident, with an audit trail.
For the portfolio, show a reproducible container build, a vulnerability scan, a health check, least-privilege runtime settings, and a tested rollback, plus the runbook. A blockchain DevOps engineer hiring loop scores that decision trail. A tool list without it loses to a smaller project that shows who gets paged and how the last bad release was undone.
Choose Your Next Web3 Infrastructure Role
A chain can keep producing blocks while your application serves stale balances. That makes infrastructure uptime an economic correctness problem: delayed or inconsistent data can affect user decisions, protocol operations, and funds at risk. Choose a role where you can explain how you detect that failure and limit its impact.
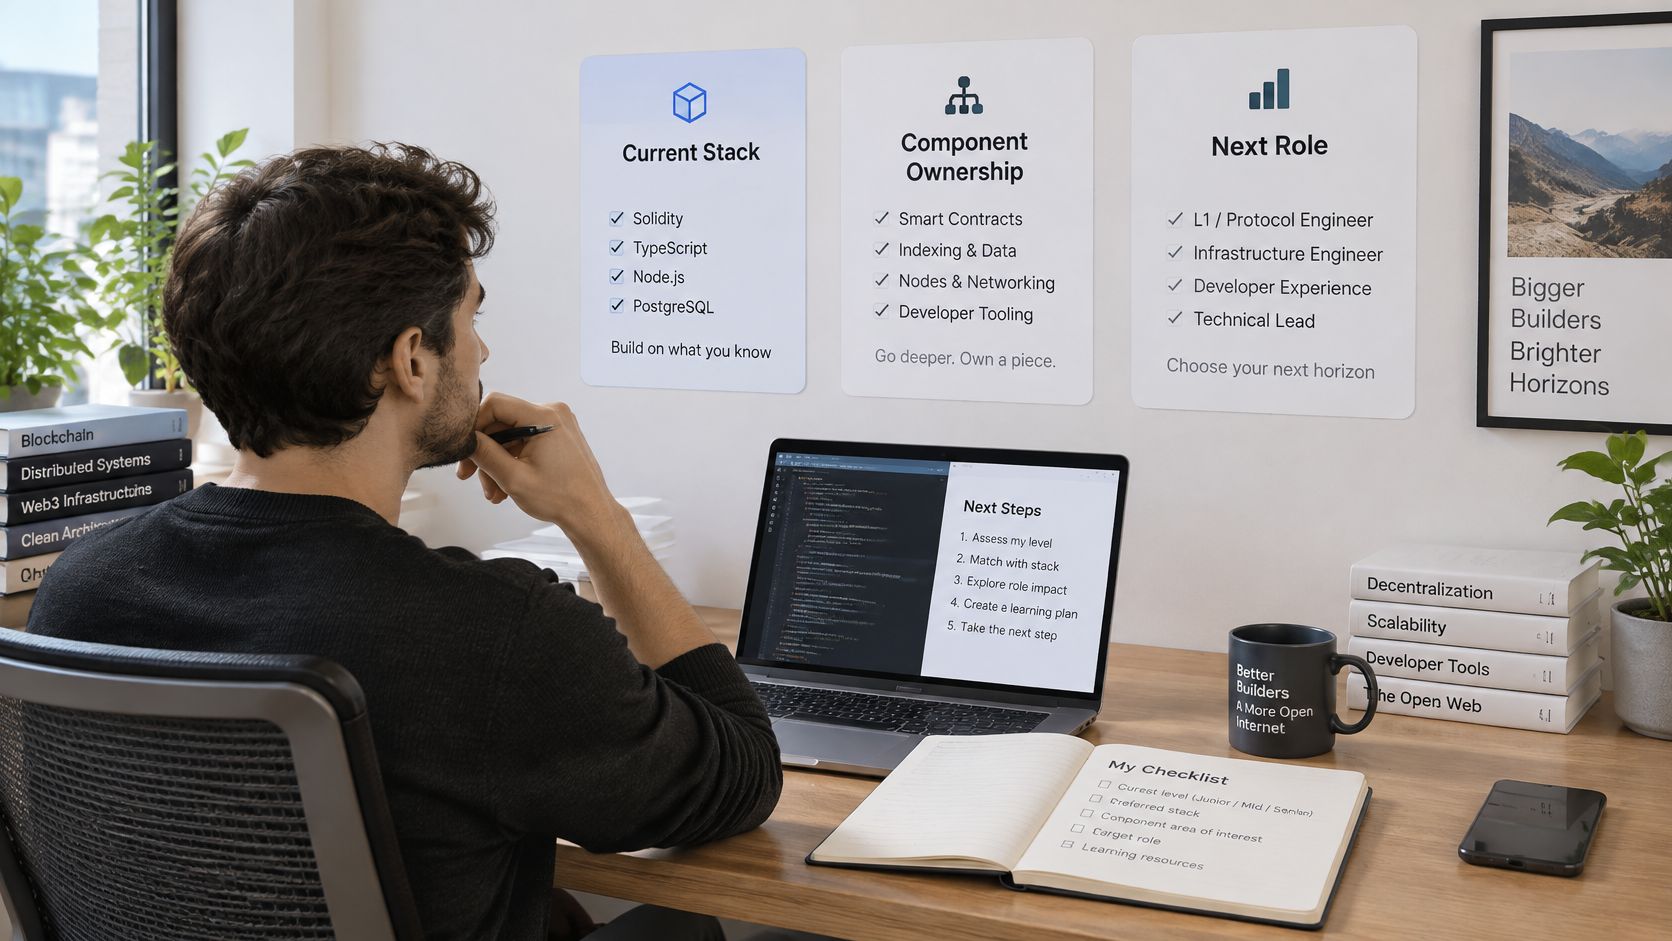
Before applying, map the systems you can operate against the ones you can only name. For one service, identify its user-facing signal, the guardrail that protects correctness, and the rollback path. Then prepare a portfolio project with a runbook, a vulnerability scan, and a rollback you can demonstrate.
A hiring loop may ask how you would respond to rising indexer lag, a node falling behind, or an RPC gateway returning errors. Answer with the signal you would check, the guardrail you would preserve, and the rollback you would use. For a project, show the decision trail: what triggered action, what prevented a wider failure, and how you would restore a known-good release.
Blockchain Jobs lists 6,934 open roles across crypto, DeFi and Web3, organised into 21 categories. Its DevOps & Infrastructure category can be filtered for remote roles. Compare listings against the systems you can own, and note which service indicators, guardrails, and rollback responsibilities each role names. You can also sign up for daily email alerts about newly posted blockchain and Web3 jobs.
Write down three indicators you can explain in an interview, including what action each should trigger. Then apply to a role whose operational responsibilities match that evidence.
Visit Blockchain Jobs to browse DevOps & Infrastructure roles and choose one where you can defend the reliability decisions behind the service.