On Chain Data Analytics: A 2026 Career Guide
You've been asked to answer a deceptively simple question: which funds bought a token before launch? You open Etherscan, copy wallet addresses into a spreadsheet, hit RPC rate limits, and discover that raw blocks aren't a dataset. They're an execution record that still needs to be decoded, indexed, modeled, and tested before anyone should trust the answer.
That moment is familiar to junior analysts entering Web3. On chain data analytics looks like dashboard work from the outside, but the valuable work happens underneath, where analysts reconcile fragmented data, document attribution confidence, and turn blockchain activity into decisions a compliance team, fund, protocol, or engineering group can defend. The market is expanding beyond trader tooling into compliance, risk, and market intelligence. One estimate values the global on-chain analytics market at USD 1.42 billion in 2024, with a projection of USD 7.83 billion by 2033, implying a 20.8% CAGR, while another estimate for crypto compliance and blockchain analytics places the market at USD 2.90 billion in 2025 and projects USD 14.63 billion by 2032, with a 26.0% CAGR (DataIntelo's on-chain analytics market estimate).
This guide takes a hiring lens. You'll see what primitives to learn, which platforms are useful for which questions, how production pipelines fail, what interviewers test, and which skills translate into better-paid roles.
Why On Chain Data Analytics Now Feels Like 2015 Data Science
The first-week problem
A junior analyst's first week often starts with a request from a CTO: “Find the funds that bought TOKENX before launch.” The analyst searches Etherscan, identifies a few contract interactions, copies addresses into Excel, and tries to compare timestamps manually. Then the RPC provider starts throttling requests, internal contract calls don't appear in the ordinary transaction view, and token transfers sit inside event logs that need ABI decoding.
The analyst hasn't failed. The workflow has exposed the core problem. A block explorer is excellent for inspecting an individual transaction, but it isn't automatically a historical warehouse, an entity-resolution system, or a reproducible research environment.
The field's infrastructure has matured considerably since the early days. One institutional data provider says its coverage reaches back to 2010, includes full aggregate and trade-level history for more than 10,000 coins and 300,000 crypto and fiat trading pairs, and supplies real-time on-chain metrics for Bitcoin, Ethereum, and other EVM chains (CoinDesk Data). That depth supports research and monitoring, but it doesn't remove the analyst's responsibility to understand schemas and limitations.
The 2015 comparison is useful
The situation resembles early data science, when teams had to establish event logging, learn SQL, build transformation conventions, and decide which definitions belonged in a shared warehouse. Web3 teams face the same organizational problem with additional protocol complexity. One Ethereum data framework split the chain into six datasets, including blocks and transactions, internal Ether transactions, contract information, contract calls, ERC20 token transactions, and ERC721 token transactions, because raw chain data is difficult to analyze directly (the peer-reviewed Ethereum dataset framework).
That's why your learning plan should be practical:
- Learn the primitives: Understand transactions, traces, events, logs, state changes, blocks, receipts, and reorgs.
- Build query fluency: Use SQL in Dune or Flipside, then reproduce important logic in Python against a node or warehouse.
- Practice attribution: Treat wallet labels as evidence with confidence, not as ground truth.
- Ship production-minded work: Add tests, gap checks, documentation, and clear assumptions to every portfolio project.
Hiring rule: A polished dashboard gets attention. A defensible metric definition gets you hired.
The tooling is fragmented and rough. That's exactly why practitioners with strong fundamentals remain scarce and can command serious compensation.
The Four Primitives Every On Chain Dataset Is Built On
Start with one concrete example: a USDT transfer on Ethereum. The visible result might be a balance moving from one address to another, but several data primitives describe what happened, and each answers a different question.
Transaction
A transaction is the top-level signed envelope submitted to the network. It includes the sender, recipient, value, nonce, gas settings, and calldata. In a direct native-asset transfer, the value field can describe the amount sent. In a USDT transfer, the transaction usually calls the USDT contract, and the token amount is encoded in calldata for the contract method.
Full nodes expose transactions natively, so transaction tables are usually the easiest starting point. They're also where inexperienced analysts make their first serious mistake: they search the native value field and conclude that no funds moved because the transaction's native ETH value is zero.
Trace
A trace records internal calls produced while a transaction executes. A router may call a token contract, which may update balances and emit logs, while a vault or proxy adds further calls. Debug APIs such as debug_traceTransaction can expose that execution path, but traces generally require archive-capable infrastructure or specialized provider access.
A trace answers, “What did the transaction cause contracts to call?” It's indispensable for fund-flow investigations and complex DeFi interactions.
Event and log
An event is the structured message a smart contract emits. For a USDT transfer, the familiar Transfer(address from, address to, uint256 value) event records the token movement, with indexed fields represented through topics and the amount stored in event data. An ABI tells an indexer how to decode those fields into readable columns.
A log is the lower-level receipt data that stores emitted event information. Logs are written into receipt structures, while events are the ABI-interpreted meaning analysts assign to those logs. Specialized indexers such as The Graph organize decoded events for application queries, but the quality of the result depends on the contract schema and handler logic.
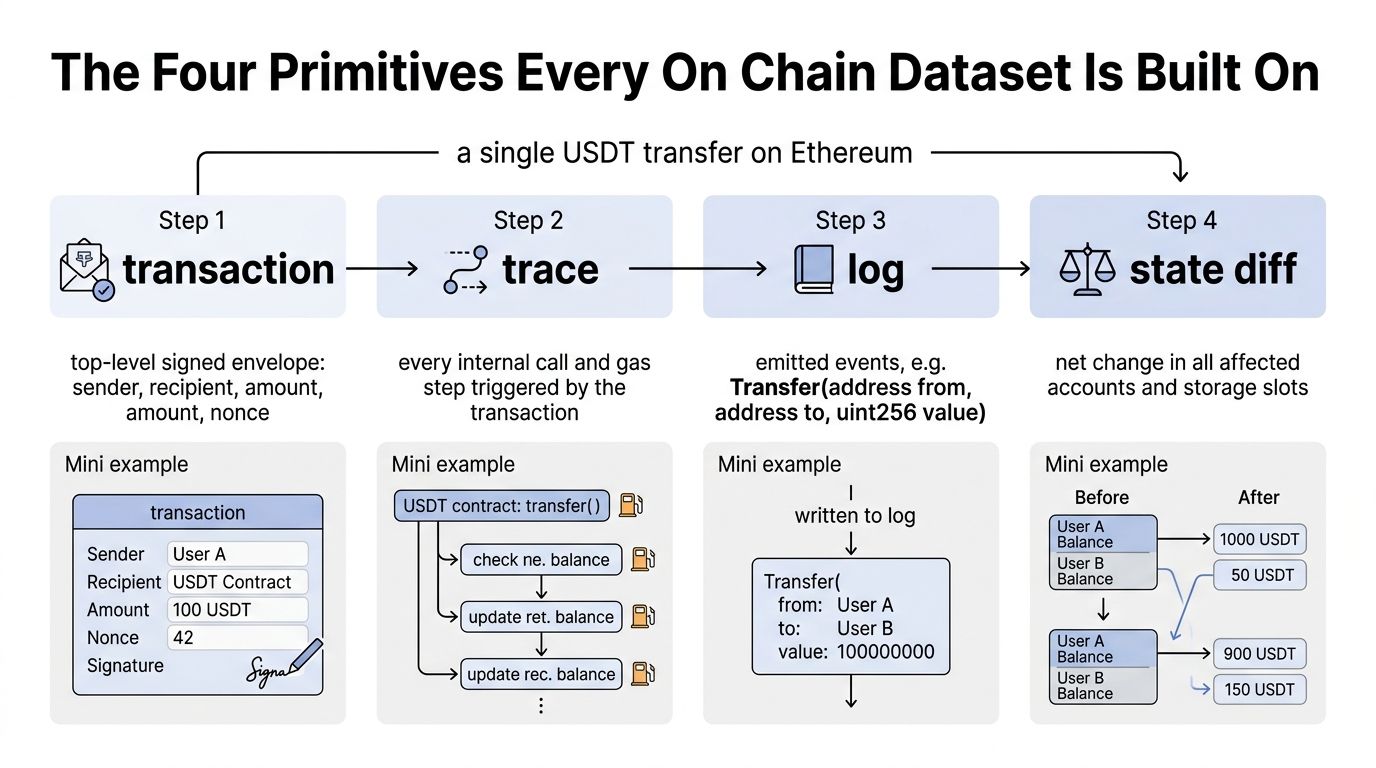
Most analytic bugs come from confusing one primitive for another. A transaction table can miss internal transfers. A token-transfer table can omit unusual contract behavior. A decoded event can look authoritative while a proxy upgrade has changed the contract's implementation. Learn to ask which primitive supports the claim before you write the query.
Comparing the Major On Chain Analytics Platforms
Choose the platform based on the question, not the brand. A hiring manager doesn't need you to praise every tool. They need you to explain why a particular source is appropriate, what it omits, and how you'd validate the result elsewhere.
Dune is the best starting point for SQL-first community research and ad hoc dashboards across EVM chains. It's fast for portfolio work and useful for learning common schemas, but public queries can be noisy, duplicated, or built on inconsistent assumptions. Nansen is stronger when pre-labeled wallet segments and smart-money tracking matter immediately. Its convenience comes with a cost, and its conclusions depend heavily on the quality and coverage of its labels.
The Graph suits protocol-specific subgraphs that power dapp frontends and low-latency application reads. You'll need to design the schema and handlers up front, which makes it a poor substitute for exploratory research but a strong choice for stable protocol data products. Blockchair works well for multi-chain explorer analysis and bulk CSV exports when you need a focused, one-off investigation without building a warehouse.
Flipside and Messari are useful for curated research and cleaner analytical models than an unreviewed public query. Their strongest value appears when consistent definitions and reusable datasets matter more than improvisation. Neither platform removes the need to understand source coverage.
| Platform | Best For | Trade-off |
|---|---|---|
| Dune | SQL-first EVM research and public dashboards | Queries are public and data quality varies |
| Nansen | Pre-labeled wallets and smart-money workflows | Expensive and dependent on labels |
| The Graph | Protocol-specific subgraphs and application reads | Requires schema design before querying |
| Blockchair | Multi-chain exploration and bulk exports | Better for focused investigations than ongoing modeling |
| Flipside | Curated, incentivized community research | Coverage and model conventions still need review |
| Messari | Structured market and protocol research | Less flexible than building your own raw pipeline |
| Archive RPC | True traces and low-level execution analysis | Operationally demanding and not a polished analytics layer |
For enterprise teams evaluating non-EVM ecosystems, a resource such as Solana Data for Enterprise can help frame the different data requirements of high-throughput chain environments. The point isn't to collect subscriptions. It's to know when a community query is enough, when a curated model is safer, and when only an archive RPC can answer the question.
If you're targeting roles where analytics intersects with deployment, study how operational teams use data in positions such as this Chainalysis deployment strategist opportunity. Analysts who can translate findings into implementation decisions usually stand out from dashboard-only candidates.
Core Methods Behind Trustworthy On Chain Analysis
Reliable analysis combines graph analysis, entity resolution, and heuristics. Treating any one of them as magic produces fragile conclusions.
Graph analysis follows the money
Suppose an exploit drains assets into an externally owned account, moves value through a contract, splits the flow across several addresses, and eventually reaches a mixer or exchange deposit. A balance chart shows the endpoints. A transaction graph shows the route, timing, branching, and repeated relationships.
Graph traversal helps identify whether apparent volume came from independent users or a coordinated cluster. It can also expose wash trading when the same wallets repeatedly send assets through related contracts and return value to a common controller. Your interview answer should include depth limits, asset normalization, and rules for stopping at known services. Unlimited traversal creates noise rather than insight.
Entity resolution turns addresses into research units
A fund rarely cares about one wallet in isolation. It cares about a wallet cluster, treasury, custodian, market maker, or protocol-controlled set of addresses. Entity resolution combines public labels from sources such as Nansen and Etherscan with first-party evidence, common-funder relationships, operational timing, and known contract interactions.
The output must preserve uncertainty. A label inherited from a third party isn't equivalent to a direct disclosure. Analysts should separate “this address shares structural control with the cluster” from “this cluster belongs to a named fund.”
Heuristics are tests, not facts
Useful heuristics include common-funder detection, dormancy-to-activity transitions, gas-price fingerprints, and repeated transaction-shape patterns. Each can produce false positives. Relayers, account abstraction, intent-based architectures, exchange batching, and automated treasury systems can make unrelated users look connected.
A 2025 review highlights persistent gaps in data accessibility, scalability, accuracy, and interoperability, reinforcing that standardization remains a central problem for cross-chain analytics (the review of blockchain data analytics). Attribution coverage is also unreliable when wallets are encoded, activity is fragmented across chains, and bots distort signals (Global Ledger's blockchain analytics trends).
| Method | Best For | Typical Failure Mode |
|---|---|---|
| Graph analysis | Fund-flow tracing and coordination detection | Traversal follows shared infrastructure rather than shared control |
| Entity resolution | Wallet clusters and named-entity research | Weak labels become overstated as certainty |
| Heuristics | Prioritization and anomaly screening | Patterns generate false positives in automated systems |
Practical rule: Every attribution output should include the evidence, the confidence level, and the reason an analyst might be wrong.
How Real Teams Build an On Chain Analytics Pipeline
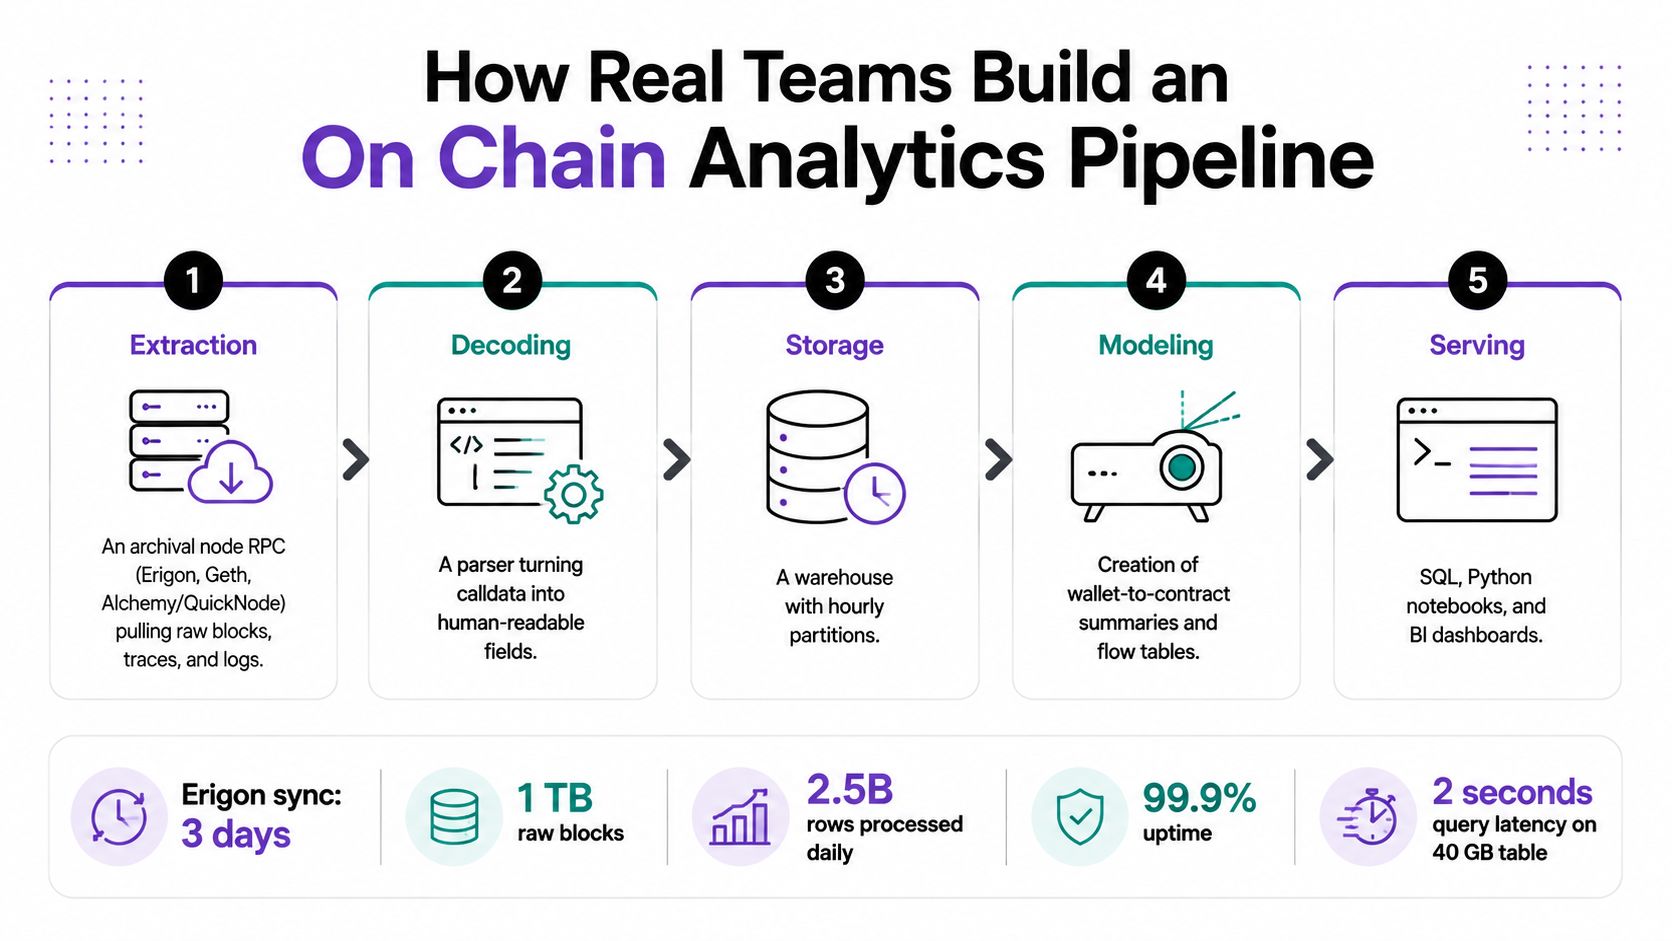
A production pipeline starts with raw chain access and ends with a serving layer. The candidate who can describe every handoff is more valuable than the candidate who only knows how to write a dashboard query.
Extract and store the raw record
Teams may use Erigon or Geth, or a managed provider such as Alchemy or QuickNode, to extract blocks, traces, and logs. They land the data in Parquet or Iceberg tables, commonly backed by S3, or load it into Snowflake or BigQuery for warehouse processing.
The extraction layer must handle RPC rate limits, node synchronization gaps, archive access, and chain reorganizations. Reorg handling isn't an edge detail. If the pipeline doesn't identify replaced blocks and reverse derived records, downstream balances and flows can become internally inconsistent.
Decode before modeling
The decoder parses calldata and logs against contract ABIs. ABIgen-generated bindings can support typed application code, while Subsquid-style handlers can process chain events into domain-specific records. A decoder also tracks proxy implementations and contract upgrades, because schema drift can break a previously correct event model.
The transformation layer enriches transfers with USD prices, entity labels, protocol classifications, and deduplication logic across chains. Analysts should also monitor unbounded event-table growth, missing block ranges, duplicate records, and unexpected field changes.
Serve decisions, not just rows
dbt models can feed Dune queries, Python notebooks, BI dashboards, reverse-ETL systems, CRM records, and Slack alerts. The serving layer should expose stable definitions such as net flow, active holder, protocol user, and suspicious transfer, rather than forcing every consumer to reinterpret raw events.
A recent real-time architecture reported 0.2–0.5 seconds for 200-token queries at 5k–10k holders, 0.7–2.0 seconds for the same query size at 100k holders, and about 1.5–4.0 seconds for single-token queries at 1M–5M holders (VeloDB's dual-pipeline architecture). The lesson for interviews is straightforward: indexing, caching, concurrency, and cardinality determine whether a dashboard can serve operational workflows.
For a practical view of roles that combine remote work with blockchain data systems, review remote blockchain data analytics roles.
High-Leverage Use Cases Hiring Managers Care About
A hiring manager doesn't approve headcount for attractive charts. They approve it when an analyst can reduce uncertainty, shorten incident response, support a product decision, or satisfy a legal obligation.
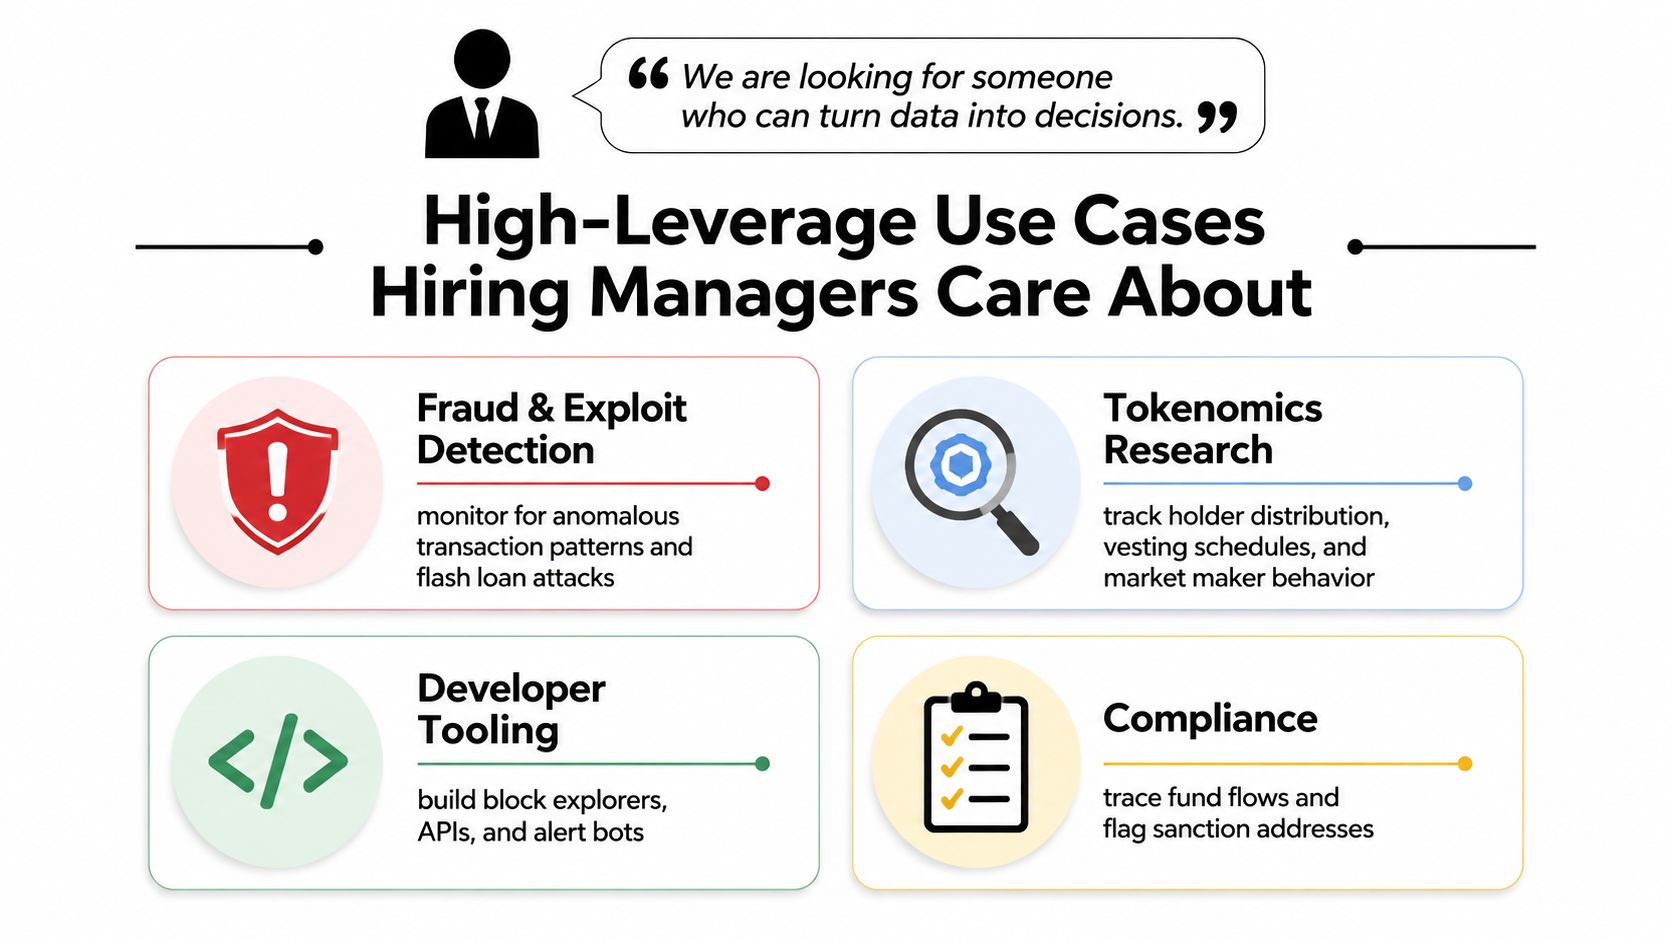
Fraud and exploit detection
The deliverable is an incident-response system, not a retrospective screenshot. You should be able to identify abnormal transaction patterns, follow stolen assets across EOAs and contracts, flag flash-loan behavior, and produce a timeline that investigators can reproduce. The work rewards graph reasoning and fast validation under pressure.
Tokenomics research
Token teams need circulating-supply models, holder-distribution analysis, vesting and release schedules, incentive-emission tracking, and market-maker behavior. A strong candidate explains how wallet cohorts change after emissions begin and distinguishes transfers between related treasury addresses from genuine market distribution.
Developer tooling
Developer-tooling teams hire people who can build APIs, explorers, metric services, and alert bots consumed by other engineers. Latency, schema stability, monitoring, and service-level expectations matter more than visual polish. If your portfolio contains only charts, add a documented endpoint or reproducible data model.
Compliance
Compliance teams need address screening, sanctions matching, fund-flow tracing, and audit trails that legal and traditional counterparties can review. The analyst must know the difference between deterministic on-chain evidence and inferred attribution. That distinction becomes especially important when teams evaluate embedded MPC wallets for exchanges, where wallet infrastructure and control models affect how transaction activity should be interpreted.
The role varies by use case. Fraud teams may favor investigative analysts and data engineers. Tokenomics groups often hire research analysts with strong financial modeling. Developer tooling needs engineers who understand data contracts. Compliance organizations prioritize analysts who can document evidence and communicate uncertainty.
Career Paths, Salaries, and Skills for On Chain Analysts
The career ladder is less about years served than about the size of the decision you can support. A junior analyst answers a defined question. A senior analyst establishes the method, challenges the assumptions, and explains what the business should do next.
Progression by responsibility
At junior level, focus on SQL fluency in Dune or Flipside, basic Solidity reading, and one portfolio dashboard with a clear metric specification. A posted on-chain analyst role asked for at least 3 years of data analysis experience, including 1 year focused on on-chain or crypto analytics, plus SQL and tools such as Dune Analytics, Nansen, Flipside, or Messari (the posted on-chain analyst role).
Mid-level analysts should own an entity-clustering or wallet-labeling pipeline, write Python ETL against an RPC node, and defend methodology in writing. Senior analysts ship research that changes a product or investment thesis, mentor others, and make vendor decisions between Dune, Nansen, and an in-house warehouse. Leads set the roadmap, hire, and communicate with exchanges, foundations, and executives.
Salary data varies by employer and market. A 2026 career guide lists junior analysts at $80k–$110k base, mid analysts at $110k–$140k, senior analysts at $140k–$175k, and lead or head roles at $170k–$220k base, with token-inclusive total compensation reaching as high as $350k+ (the on-chain data analyst career guide). Another salary page reports a $100,000 median base and $160,000 maximum, while listing SQL, Python, Dune, Flipside, The Graph, DeFi knowledge, token economics, and dashboard creation as readiness signals (the on-chain data analyst salary page). A Consensys posting advertised $117,000–$187,000 per year for a U.S.-based Onchain Data Analyst role (the Consensys listing).
| Level | Core Skills | Expected Output | Base Salary (USD) |
|---|---|---|---|
| Junior | SQL, Dune or Flipside, basic Solidity, metric definitions | Reproducible dashboard and written analysis | $80k–$110k |
| Mid | Python ETL, RPC access, entity resolution, methodology writing | Maintained pipeline and defensible wallet research | $110k–$140k |
| Senior | Research leadership, vendor evaluation, mentoring, protocol fluency | Analysis that informs product or investment decisions | $140k–$175k |
| Lead or head | Roadmap ownership, hiring, partner communication, governance | Data strategy and team delivery | $170k–$220k |
Expect interview exercises built around decoded tables, a labeled wallet-cluster walkthrough, and a whiteboard prompt about heuristic design. Web2 SQL and data-modeling skills transfer well. Web3 adds contract execution, chain reorganizations, wallet attribution, protocol mechanics, and uncertainty management, so generic dashboard experience isn't enough.
Browse on-chain data and analytics jobs and compare requirements against your portfolio. Build one project that demonstrates raw-data judgment, one that demonstrates business interpretation, and one that demonstrates production discipline.
Blockchain Jobs gives Web3 candidates a focused place to find roles across data, engineering, compliance, and related functions, including remote-friendly opportunities. Visit Blockchain Jobs to compare current openings, identify the skills employers repeat, and target your next on-chain analytics application with evidence rather than generic credentials.